Script and Query report creation - walkthrough with examples.
In this session, we create a script report with Report summary Graph with two legs Data listing Color the value with condition Message Client side scripting SQL and a little bit of Query report.
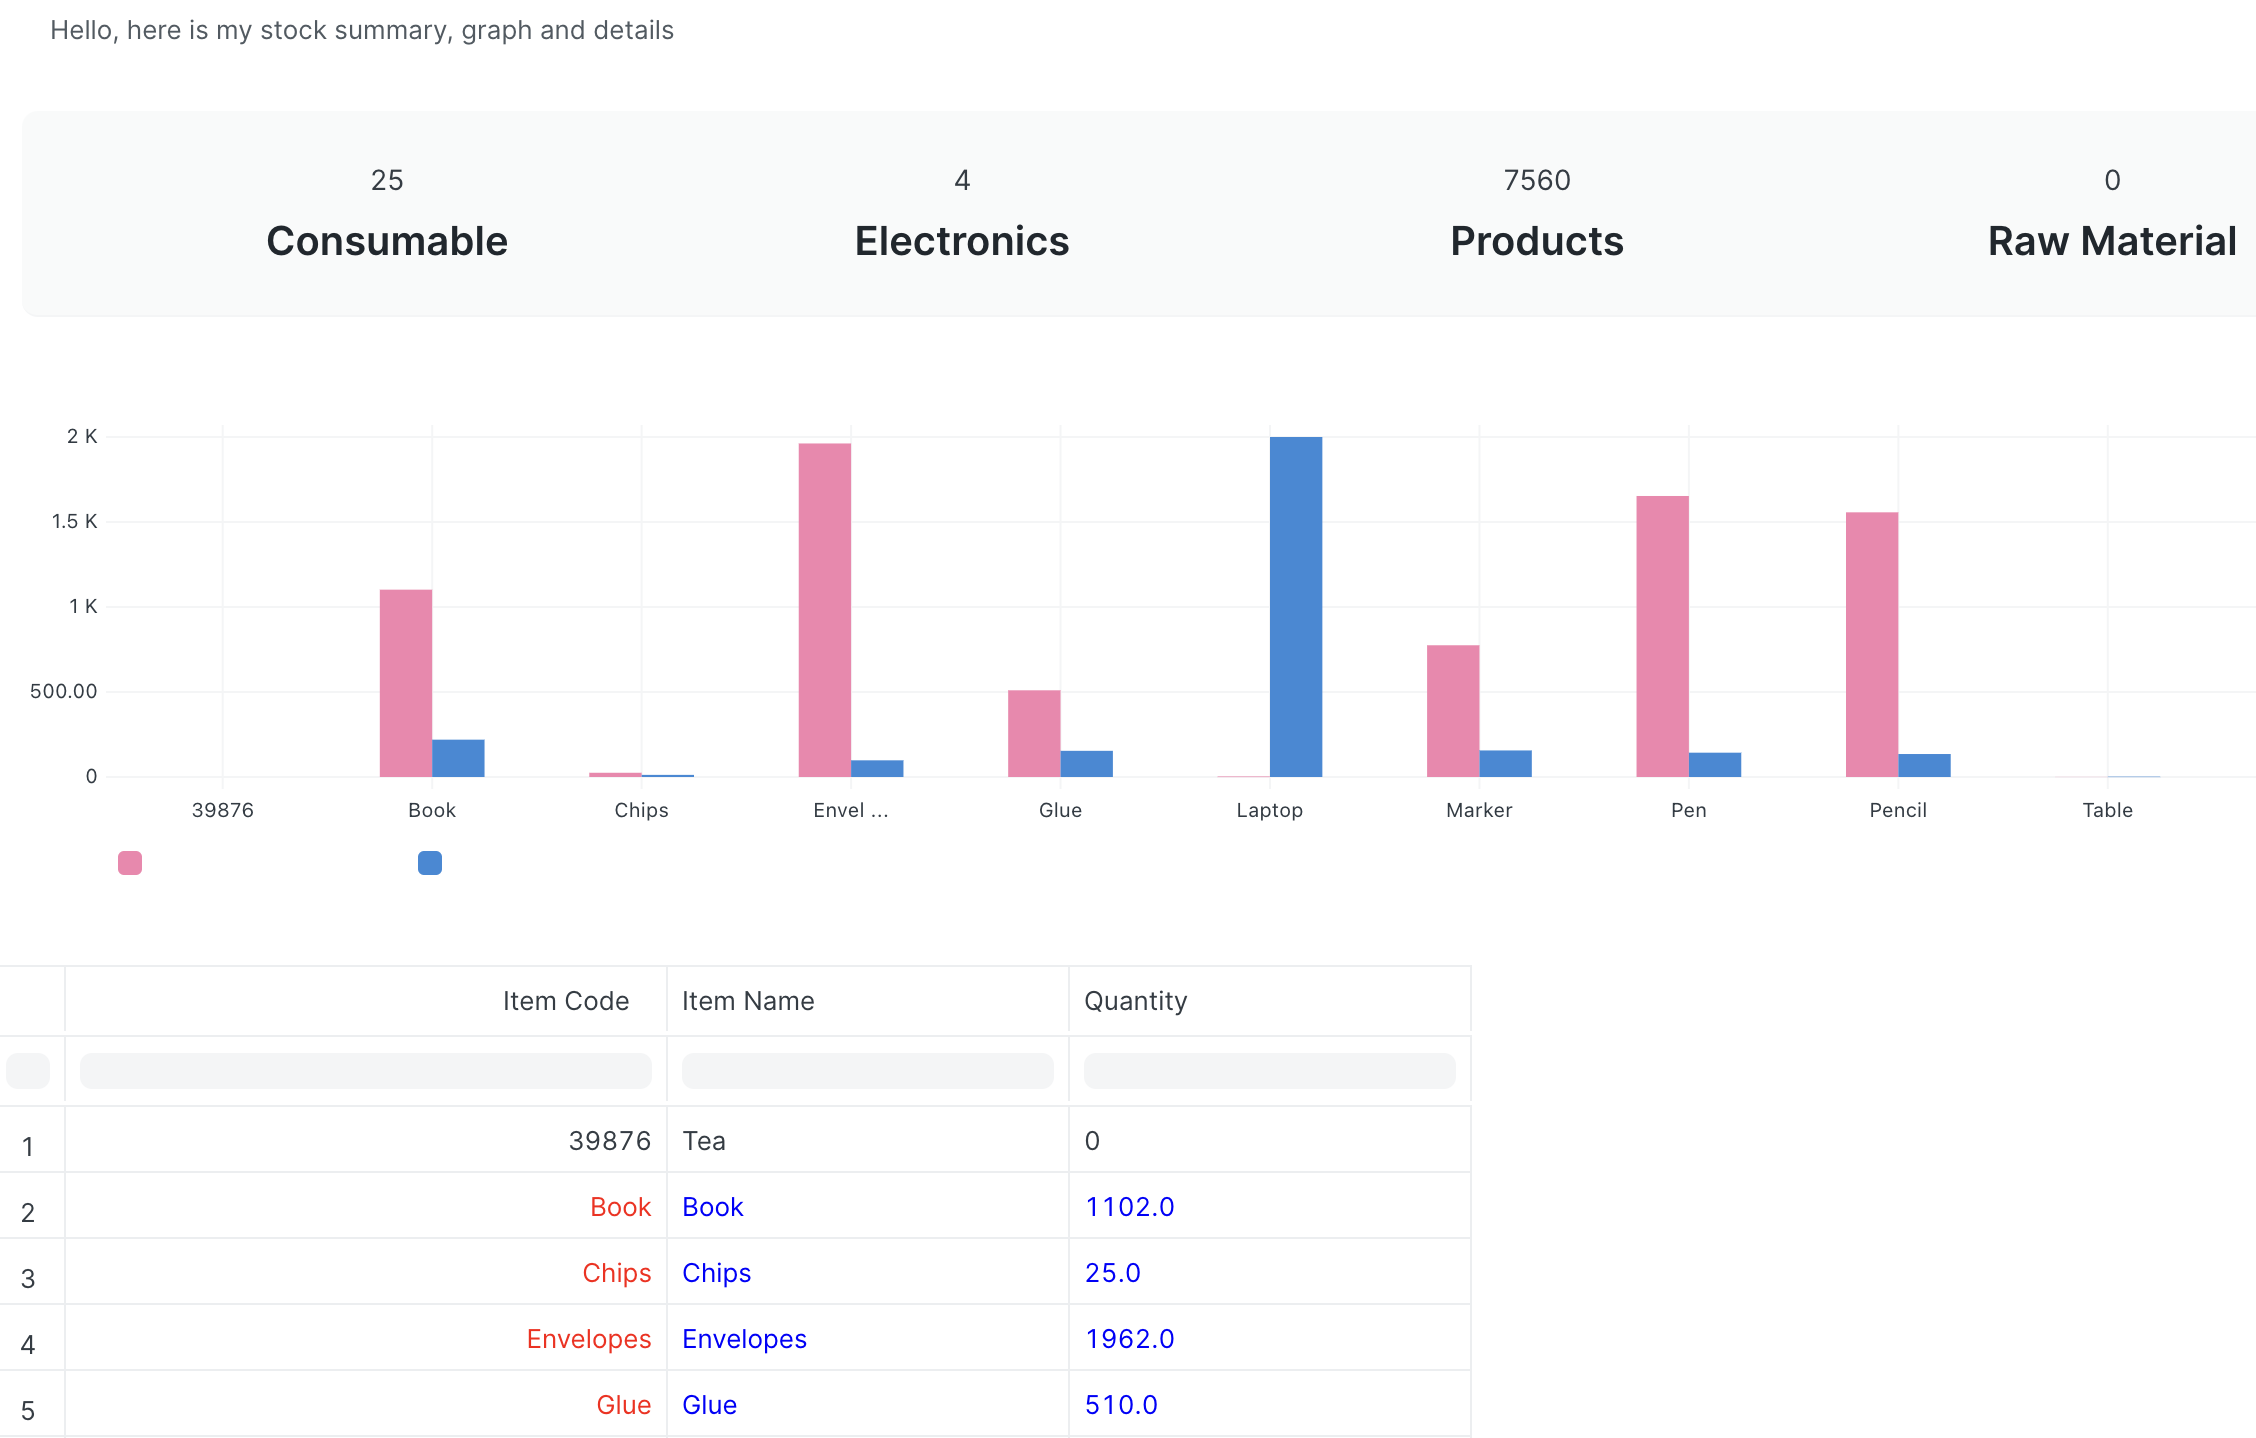
At the end of this session we will have a report like shown above
In this session, we create a script report with
Report summary
Graph with two legs
Data listing
Color the value with condition
Message
Client side scripting
SQL
and a little bit of Query report.
This document is based on the video ( https://youtu.be/Pv6DXXbgJKA ) , details of all the codes below explained in that video.
Lets start by creating simple message
Standard - NO
***** Note: Lot of indent issues with the following codes, please fix it if you are copying the code. Better you write on your own
data = columns, data, "Hello, here is my stock summary, graph and details", chart, report_summary
data = None, None, "Lets learn Script reporting", None, None
Now lets have two colums
columns = ["Letter","Number","Colour"]
mydata = [['Row-1',2,'Red'],['Row-2',2,'Blue'],['Row-3',8,Yellow'],['Row-4',7,'Violet']]
data = columns, mydata, "Lets learn Script reporting", None, None
Color it
columns = ["Letter","Number","Colour"] # list
mydata = [['Row-1',2,'<span style="color: red;">Red</span>'],['Row-2',2,'Blue'],['Row-3',8,'Yellow'],['Row-4',7,'<span style="color: violet;">Violet</span>']] # list within list
data = columns, mydata, "Lets learn Script reporting", None, None
lets do report summary
report_summary = [
{"value": "100", "label": "label1", "datatype": "Data"},
{"value": "200", "label": "label2", "datatype": "Data"},
{"value": "300", "label": "label3", "datatype": "Data"}
]
data = None, None, None, None, report_summary
Have a total
Just tick the box
Lets plot a graph
columns = ["Letter","Number"]
data = [['c',2],['a',2],['t',8],['s',7]]
mydataset = {"values": [3000, 6500, 4250, 1000]}
chart = {'data':{'labels':['Saudi','Qatar','UAE','Oman'],'datasets':[mydataset]},'type':'bar'}
data = columns, data, None, chart, None
Lets redesign column
columns = [
_("Letter") + "::120",
_("Number") + "::50",
]
Lets plot two graph
columns = ["Letter","Number"]
data = [['c',2],['a',2],['t',8],['s',7]]
mydataset = {"values": [3000, 6500, 4250, 1000]}
mydataset2 = {"values": [2000, 5500, 500, 100]}
chart = {'data':{'labels':['Saudi','Qatar','UAE','Oman'],'datasets':[mydataset,mydataset2]},'type':'bar'}
data = columns, data, None chart, None
Lets change Graph style
chart = {'data':{'labels':['Saudi','Qatar','UAE','Oman'],'datasets':[mydataset,mydataset2]},'type':'bar'}
chart = {'data':{'labels':['Saudi','Qatar','UAE','Oman'],'datasets':[mydataset,mydataset2]},'type':'line'}
chart = {'data':{'labels':['Saudi','Qatar','UAE','Oman'],'datasets':[mydataset,mydataset2]},'type':'pie'}
Lets filter it
frappe.query_reports['test report 7'] = {
"filters": [{
fieldname: "number_filter",
label: "Number Filter",
fieldtype: "Select",
options: ["Choice-1","Choice-2","Choice-3","Choice-4","Choice-5","Choice-6","Choice-7"],
default: 3
}]
}
Lets filter on GUI
Both Select , and Link
Lets look into Query report
******Note: building SQL for ERPNext we have covered on https://www.youtube.com/watch?v=DMGoIx5LiHI
columns = [
_("Email") + "::120",
_("Name") + "::120",
_("Gender") + "::60",
]
data = frappe.db.sql("SELECT `email`,`name`, `gender` FROM `tabUser`", as_dict=True)
data = columns, data
Lets color gender-wise
columns = [
_("Email") + "::120",
_("Name") + "::120",
_("Gender") + "::60",
]
data = frappe.db.sql("SELECT `email`,`name`, `gender` FROM `tabUser`", as_dict=True)
for row in data:
# Check if gender is female
if row.get('gender') == 'Female':
# Apply blue color to the entire row
row['email'] = '<span style="color: blue;">' + row.get('email') + '</span>'
row['gender'] = '<span style="color: blue;">' + row.get('gender') + '</span>'
row['name'] = '<span style="color: blue;">' + row.get('name') + '</span>'
data = columns, data
Lets filter it
frappe.query_reports['ERPGulf stock analysis'] = {
"filters": [{
fieldname: "name",
label: "User Name",
fieldtype: "Link",
options: "User",
default: "Administrator"
}]
}
On script , change these line to reflect filter
mysql = "SELECT `email`,`name`, `gender` FROM `tabUser` where name like '%" + filters.name + "%'"
data = frappe.db.sql(mysql , as_dict=True)
Lets work on stock data
columns = [
_("Code") + "::120",
_("Name") + "::120",
_("Stock") + "::60",
]
data = frappe.db.sql("""SELECT
`tabItem`.`item_code` AS `code`,
`tabItem`.`item_name` AS `name`,
SUM(`tabBin`.`actual_qty`) As stock
FROM
`tabItem`
JOIN
`tabBin` ON `tabItem`.`name` = `tabBin`.`item_code`
GROUP BY
`tabItem`.`item_code`,
`tabItem`.`item_name`""", as_dict=True)
for row in data:
if float(row.get('stock')) >= 25:
float_value=1
row['stock'] = '<span style="color: blue;">' + str(row.get('stock')) + '</span>'
row['name'] = '<span style="color: blue;">' + str(row.get('name')) + '</span>'
row['code'] = '<span style="display: inline-block; padding: 2px; margin: 10px; border: 1px solid black;"">' + str(row.get('code')) + '</span>'
data = columns, data
Coloring data
for row in data:
if float(row.get('stock')) >= 25:
float_value=1
row['stock'] = '<span style="color: blue;">' + str(row.get('stock')) + '</span>'
row['name'] = '<span style="color: blue;">' + str(row.get('name')) + '</span>'
row['itemcode'] = '<span style="color: red;">' + str(row.get('itemcode')) + '</span>'
chart with SQL
def get_chart_data(query):
data = frappe.db.sql(query, as_list=1)
datasets = []
labels = []
for d in data:
labels.append(d[0])
datasets.append(d[2])
chart = {"data": {"labels": labels, "datasets": [{'values':datasets}]}}
chart["type"] = "line"
return chart
columns = [
{
'fieldname': 'itemcode',
'label': _('Item Code'),
'fieldtype': 'Data',
'options': 'User',
'width': 300
},
{
'fieldname': 'name',
'label': _('Item Name'),
'fieldtype': 'Data',
'align': 'left',
'width': 200
},
{
'fieldname': 'stock',
'label': _('Quantity'),
'fieldtype': 'Data',
'width': 200,
'align': 'left'
},
]
mysql = """SELECT
`tabItem`.`item_code` AS `itemcode`,
`tabItem`.`item_name` AS `name`,
SUM(`tabBin`.`actual_qty`) As stock
FROM
`tabItem`
JOIN
`tabBin` ON `tabItem`.`name` = `tabBin`.`item_code`
GROUP BY
`tabItem`.`item_code`,
`tabItem`.`item_name`"""
data=frappe.db.sql(mysql,as_dict=True)
for row in data:
if float(row.get('stock')) >= 25:
float_value=1
row['stock'] = '<span style="color: blue;">' + str(row.get('stock')) + '</span>'
row['name'] = '<span style="color: blue;">' + str(row.get('name')) + '</span>'
row['itemcode'] = '<span style="color: red;">' + str(row.get('itemcode')) + '</span>'
chart = get_chart_data(mysql)
data = columns, data, None, chart
Summary with SQL
sql_summary = """
SELECT
`tabItem`.`item_group` AS `group`,
SUM(`tabBin`.`actual_qty`) As stock
FROM
`tabItem`
JOIN
`tabBin` ON `tabItem`.`name` = `tabBin`.`item_code`
GROUP BY
`tabItem`.`item_group`
"""
report_summary = [{"value": row.group, "label": row.stock} for row in frappe.db.sql(sql_summary,as_dict=True)]
data = None, None, None, None, report_summary
Everything together
def get_chart_data(query):
data = frappe.db.sql(query, as_list=1)
datasets = []
datasets2 = []
labels = []
for d in data:
labels.append(d[0])
datasets.append(d[2])
datasets2.append(d[3]/100)
chart = {"data": {"labels": labels, "datasets": [{'values':datasets},{'values':datasets2}]}}
chart["type"] = "bar"
return chart
columns = [
{
'fieldname': 'itemcode',
'label': _('Item Code'),
'fieldtype': 'Data',
'options': 'User',
'width': 300
},
{
'fieldname': 'name',
'label': _('Item Name'),
'fieldtype': 'Data',
'align': 'left',
'width': 200
},
{
'fieldname': 'stock',
'label': _('Quantity'),
'fieldtype': 'Data',
'width': 200,
'align': 'left'
},
]
mysql = """SELECT
`tabItem`.`item_code` AS `itemcode`,
`tabItem`.`item_name` AS `name`,
SUM(`tabBin`.`actual_qty`) As stock,
SUM(`tabBin`.`stock_value`) As stock_value
FROM
`tabItem`
JOIN
`tabBin` ON `tabItem`.`name` = `tabBin`.`item_code`
GROUP BY
`tabItem`.`item_code`,
`tabItem`.`item_name`"""
data=frappe.db.sql(mysql,as_dict=True)
for row in data:
if float(row.get('stock')) >= 25:
float_value=1
row['stock'] = '<span style="color: blue;">' + str(row.get('stock')) + '</span>'
row['name'] = '<span style="color: blue;">' + str(row.get('name')) + '</span>'
row['itemcode'] = '<span style="color: red;">' + str(row.get('itemcode')) + '</span>'
chart = get_chart_data(mysql)
sql_summary = """
SELECT
`tabItem`.`item_group` AS `group`,
SUM(`tabBin`.`actual_qty`) As stock
FROM
`tabItem`
JOIN
`tabBin` ON `tabItem`.`name` = `tabBin`.`item_code`
GROUP BY
`tabItem`.`item_group`
"""
report_summary = [{"value": row.group, "label": row.stock} for row in frappe.db.sql(sql_summary,as_dict=True)]
data = columns, data, "Hello, here is my stock summary, graph and details", chart, report_summary
Lets know your feedback on training@ERPGulf.com
******Note: building SQL for ERPNext we have covered on https://www.youtube.com/watch?v=DMGoIx5LiHI
Team ERPGulf
The team behind ERPGulf blogs here, expresses their thoughts, shares the experience, often show the frustrations. Contact us on support@ERPGulf.com
mydata = [['Row-1',2,'Red'],['Row-2',2,'Blue'],['Row-3',8,'Yellow'],['Row-4',7,'Violet']]
Hi sir I tried to create script report as your guidelines. as below i am creating a client side not standard script report. i want to get report as filter value. this is my script - columns = [ {"label": "Voucher Type", "fieldname": "vouchertype", "fieldtype": "Data", "width": "150px"}, {"label": "Voucher Number", "fieldname": "vouchernumber", "fieldtype": "Dynamic Link", "options": "vouchertype", "width": "150px"}, {"label": "Supplier", "fieldname": "party", "fieldtype": "Data", "width": "150px"}, {"label": "Party Pan", "fieldname": "partypanno", "fieldtype": "Data", "width": "150px"}, {"label": "Branch", "fieldname": "branch", "fieldtype": "Link", "options": "Branch", "width": "150px"}, {"label": "TDS Credit", "fieldname": "tdscredit", "fieldtype": "Float", "width": "150px"}, {"label": "TDS Category", "fieldname": "tdscategory", "fieldtype": "Data", "width": "150px"}, {"label": "Section Code", "fieldname": "account", "fieldtype": "Link", "options":"account", "width": "150px"}, {"label": "Transaction Date", "fieldname": "transactiondate", "fieldtype": "Date", "width": "150px"}, {"label": "Deducted By", "fieldname": "tdsdeductedby", "fieldtype": "Link", "options":"Company", "width": "150px"} ] branchfilter = '%"branchfilter"%' mysql = """ SELECT vouchertype, vouchernumber, MAX(party) AS party, MAX(partypanno) AS partypanno, branch, MAX(tdscredit) AS tdscredit, tdscategory, MAX(account) AS account, transactiondate, tdsdeductedby FROM ( SELECT 'Purchase Invoice' AS vouchertype, pi.name AS vouchernumber, pi.supplier AS party, ( SELECT pan FROM
tabSupplierWHERE name = pi.supplier ) AS partypanno, pi.branch AS branch, CASE WHEN pia.accounthead LIKE '%%TDS%%' THEN pia.basetaxamountafterdiscountamount ELSE 0 END AS tdscredit, pi.taxwithholdingcategory AS tdscategory, pia.accounthead AS account, pi.postingdate AS transactiondate, pi.company AS tdsdeductedby FROMtabPurchase Invoicepi JOINtabPurchase Taxes and Chargespia ON pi.name = pia.parent WHERE pi.docstatus = 1 AND pia.accounthead LIKE '%%TDS%%' AND pi.branch = %(branchfilter)s -- Add additional conditions as per your requirements UNION ALL SELECT 'Journal Entry' AS vouchertype, je.name AS vouchernumber, IF(jea1.account LIKE '%%TDS%%', IF(jea2.partytype = 'Supplier', s.suppliername, IF(jea2.partytype = 'Customer', c.customername, IF(jea2.partytype = 'Employee', emp.employeename, ''))), '' ) AS party, IF(jea1.account LIKE '%%TDS%%', IF(jea2.partytype = 'Supplier', s.pan, IF(jea2.partytype = 'Customer', c.taxid, '')), '' ) AS partypanno, je.branch AS branch, CASE WHEN jea1.account LIKE '%%TDS%%' THEN jea1.credit - jea1.debit ELSE 0 END AS tdscredit, je.taxwithholdingcategory AS tdscategory, GROUPCONCAT(DISTINCT jea1.account) AS account, je.postingdate AS transactiondate, je.company AS tdsdeductedby FROMtabJournal Entryje LEFT JOINtabJournal Entry Accountjea1 ON je.name = jea1.parent LEFT JOINtabJournal Entry Accountjea2 ON je.name = jea2.parent LEFT JOINtabSuppliers ON jea2.party = s.name AND jea2.partytype = 'Supplier' LEFT JOINtabCustomerc ON jea2.party = c.name AND jea2.partytype = 'Customer' LEFT JOINtabEmployeeemp ON jea2.party = emp.name AND jea2.partytype = 'Employee' WHERE je.docstatus = 1 AND jea1.account LIKE '%%TDS%%' AND je.branch = %(branchfilter)s GROUP BY je.name, jea1.partytype, jea2.partytype, jea2.party, je.branch, je.taxwithholdingcategory, je.postingdate, je.company -- Add additional conditions as per your requirements ) AS results GROUP BY vouchertype, vouchernumber, branch, tdscategory, transactiondate, tdsdeductedby;""" # Parameters for the WHERE clause params = { "branchfilter": branchfilter } mydata = frappe.db.sql(mysql, params, asdict=True) data = columns, mydata and this is js script - frappe.queryreports["TDS REPORT"] = { filters: [ { name: "branchfilter", label: "Branch", fieldtype: "Link", options: "Branch", default: "Bikaner" }, { name: "supplier", label: "Supplier", fieldtype: "Link", options: "Supplier" }, { name: "fromdate", label: "From Date", fieldtype: "Date", default: "2023-04-01" }, { name: "to_date", label: "To Date", fieldtype: "Date", default: "2023-04-30" } ] }; but i think something is wrong in the code so i cant generate the report. please help me and provide me correct code.Thanks Sunil